SvCom 6.0 has introduced a new set of methods to simplify
debugging of service applications. The debug utility was redesigned
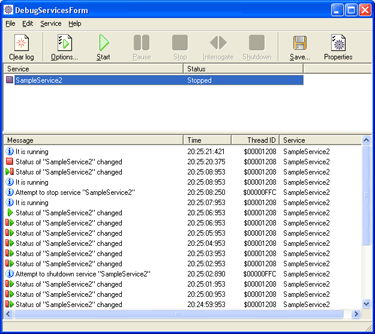
too. Now it looks as shown below:

Debug window, small image, click to enlarge
The top part of the debugger window contains the list
of all application services. Buttons Start, Stop, Pause, Continue and
Shutdown can be used to control selected service. The interrogate button
requests the service status. The detailed information about all service
events is displayed in the bottom part of the window.
As it was mentioned before you should use the /debug
key to start service in debug mode. Try to do it now and use Start and
Stop buttons to control the service. As you can see all changes of service
state are displayed in the events part of debugger's window. In addition
to this messages you can generate your own additional messages. For
example you can report a values of some variable. To do it you will
need to use SvCom Debug API. It includes the following methods:
Note that you do not need to remove any of these calls from your final
code, these methods do nothing if no /debug switch is detected. Let's
consider these methods in more detail.
 SvSendMessage


Use this message to send simple text message to the debugger. The message
will be shown in the list. The last parameter of this method is the
service's StatusHandle. You can skip it if you wish but if you specify
it the debug window will find corresponding service and its name will
be displayed in the Service column. Look on example below:


 |
procedure TSampleService2.SampleService2Execute(Sender: TObject);
begin
    while True do
    begin
        ProcessRequests(False);
        if Terminated then break;
        Sleep(1000);
        SvSendMessage(dekWarning,'Service is running',StatusHandle);
    end;
end;
|
 SvSendValue


Use this method to send name and value of variable to be monitored.
Variable's value will be sent as Variant type so any value that can
be converted to Variant can be passed to the function. An example:


 |
procedure TSampleService2.SampleService2Pause(Sender: TNtService;
    var DoAction: Boolean);
var i: Integer;
begin
    for i:=1 to 10 do
    begin
        Sleep(1000);
        ReportStatus;
        SvSendValue(dekInfo,'i',i);
    end;
end;
|
 SvSendMethodEnter
& SvSendMethodLeave


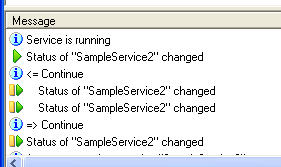
Use these methods to mark nested method calls by additional indent in
the message log window:

The following code produces these effects:


 |
procedure TSampleService2.SampleService2Continue(
  Sender: TNtService; var DoAction: Boolean);
var i: Integer;
begin
    SvSendMethodEnter('Continue',StatusHandle);
    for i:=1 to 10 do
    begin
        Sleep(1000);
        ReportStatus;
    end;
    SvSendMethodLeave('Continue');
end;
|
 SvSendClearAll


Call of this methods clears all log messages. It is useful if you need
a short part of message log only and would like to clear all previous
garbage.
 SvSendCheckpoint
& SvSendClearToCheckpoint


Use this method to simplify debugging of deep or multiple nested methods.
For example you have a loop that does a lot of computations but error
occurs on 1000000th loop only. Sure you do not want to watch all these
999999 success messages, you need the only one, that cause a problem.
To make it possible do something like that:
|
...
    for ... do
    begin
        SvSendCheckpoint('Possible error code follows');
        //Code with potential errors here
        //Use SvSendMessage, SvSendValue and othe tracing routines
        //to log important events and values
        ...
        //If there were no exceptions in the code above
        //then likely log messages written by the code are not interesting
        //so it is a good idea to clear it up to checkpoint
        SvSendClearToCheckpoint;
    end;
... |
Proceed with the next step to learn how to use
service application as a regular one.


Copyright: